


Those librarians who work in school districts know that they need to submit data each year to the California Department of Education. This year’s evaluation is located here.
The email below was sent out by Renée Ousley-Swank, School Library Technology Consultant for the CDE:
“Have you ever wondered what the California Department of Education (CDE) does with the data collected in the Annual School Library Evaluation? Wondered how you can see the data collected without asking for the reports? Or even wondered, do I need to do this, does my data really matter?
The CDE has just launched the interactive California School Libraries Viewer Geo Map, that displays the following 2021–22 data: Average weekly hours open; Average copyright date of Native American informational text; Average copyright date of complete collection; number of books in the collection; and staffing. Here is an example of what the map of California and how the data collected displays for the 2021–22 academic year:

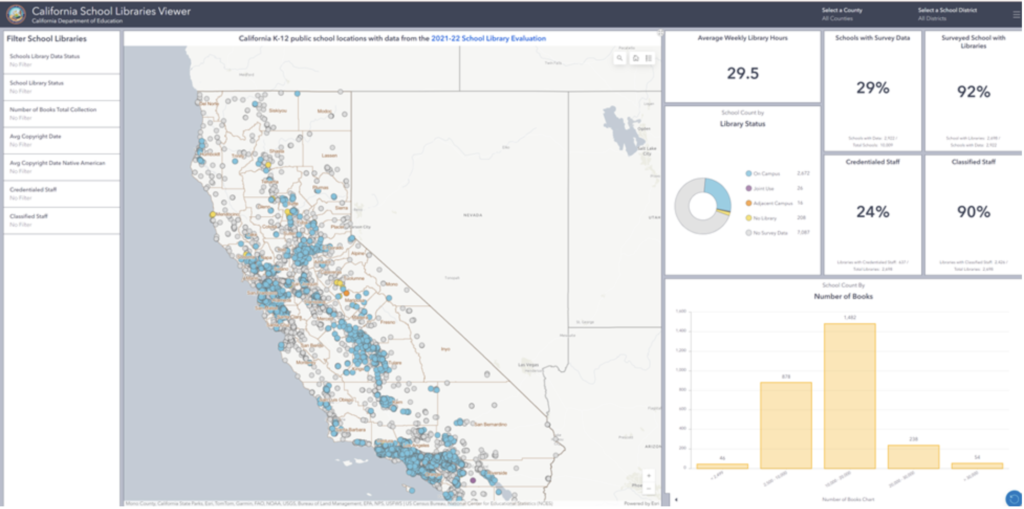
You can filter for specific topics on the left-hand side of the map. If you are interested in what the data for your county and/or school district looks like, then you can select county, and even district at the top right of the map. If you want to see the information from an individual site, click the dot and the information on the school will display:


We hope you find this tool useful and drop us a line to share how you are using the tool. One district has already shared that they discovered some of the staffing was misreported and now know to look more closely at the data they are reporting for accuracy in this year’s evaluation.”
__________________________________________________________________________________________________